
Cohort analysis applied to email marketing
The cohort analysis It is used to study the behavior or the results associated with a group of people over time. In marketing, the cohort analysis It is a technique used to study customer behavior. Thus, a cohort is a group of customers or users that have a common characteristic. Cohorts can be determined by the date when users registered on a website, or became a customer, their age, their demographic characteristics, or any other attribute that can be used to group a set of individuals. It is then assumed that something about the cohort explains certain behavior over time. In short, cohort analysis It is a useful technique for understanding how user groups behave over time.
In the field of relational email marketing, the use of a cohort analysis It can help us understand how users behave based on opens, clicks, bounces, and conversions over time, and thus predict future behaviors.
In the following example we present a cohort analysis with the aim of making the concept and its application more understandable.
Let’s say we are in July and we want to analyze the behavior of registered users over the last 6 months by linking the registration date to the newsletter and the number of buyers obtained thanks to email marketing campaigns in the following months. First, we will create the cohorts. In this case, they will be groups of registered users for each month (column «RM0»).
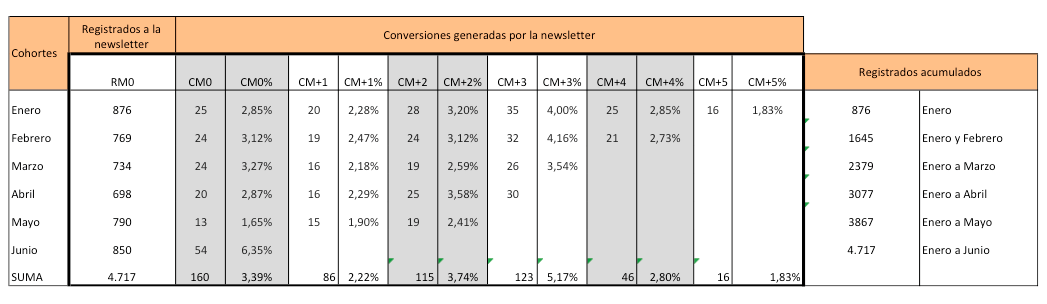
Next, in the column «CM0» we enter the number of buyers belonging to the cohort who made at least one purchase in the same month in which they registered. In CM0% we have the corresponding data. In CM+1 we enter the buyers from the cohort who made at least one purchase in the month following their registration. In M+1% we have the corresponding data, and so on. We project this mechanism for each of the cohorts until the date when the analysis ends (in this example, this date is the last month for which we have data, that is, June or CM+5).
Next we calculated what percentage % of the accumulated number of users we captured have purchased at least once. For example, in the month CM+4 we have 46 buyers. These buyers are registered users in January and February, that is 1,645 users. This means that 2.80% of the registered users will buy in the month +4.
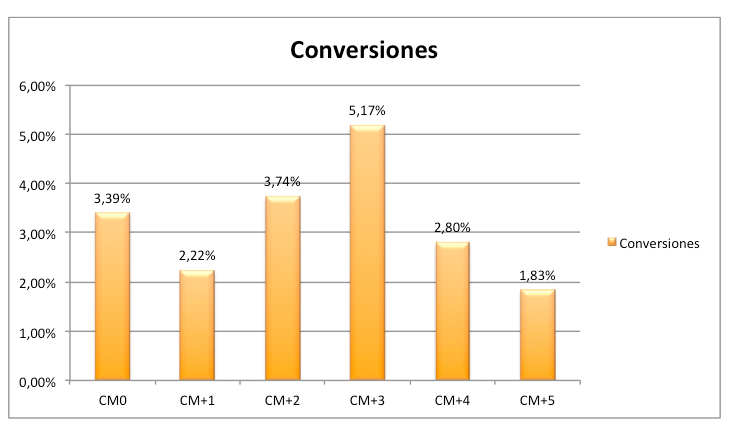
It is useful, once we have the data in the table, to present the information visually with charts. If we analyze the data from the example we are dealing with, we notice some interesting aspects: it is 3 months after registration when our email marketing actions generate more buyers. The cohort corresponding to June has a very different behavior from the others in the CM0. Was there any special offer? What was the origin of the registrations? Was there TV advertising?
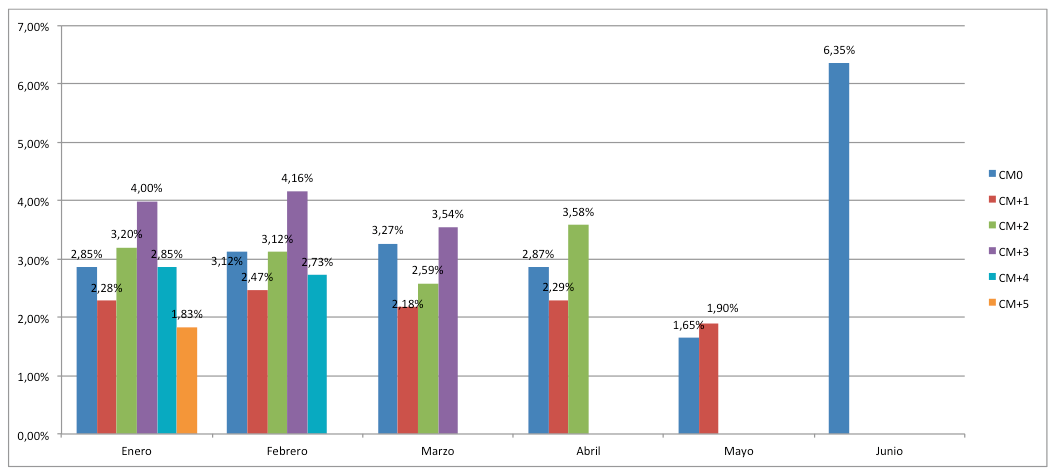
Finally, this cohort analysis It will allow us to predict/estimate how many buyers we will have in the months of January, February, March, April, May and June to come, based on the users we capture in those months.
Knowing the average order value per buyer, we can then project the revenue generated by each new user acquired in the months following registration, and this, linked to the CAC (Customer Acquisition Cost), will allow us to know whether the investment in Email Marketing (customer acquisition) is > or < to the revenue generated per customer over their entire life cycle.
