
Case Study: Nespresso integrates Facebook, QR codes and email marketing in Nespresso & The City campaign
SUCCESS CASE
- CLIENT: Nespresso Business Solutions (DABA)
- AGENCY: Digital Response (Cyberclick)
- CASE: Email marketing campaign to generate traffic to Facebook (app) and to coffee shops
SUMMARY
During the months of May and June 2013 the B2B division of Nespresso He carried out an email marketing campaign based on the Club's partner database Nespresso From Barcelona, Madrid and Valencia, with the aim of bringing traffic to an app on Facebook. Through this app, the user could discover the recipes Nespresso Available in cafeterias equipped with the AGUILA machine. In addition, the app generated a personalized voucher that could be redeemed for a recipe at one of the cafeterias participating in the action.
The email marketing campaign was the main driver of traffic to the app on Facebook, in addition to generating direct traffic to the cafes.
CAMPAIGN
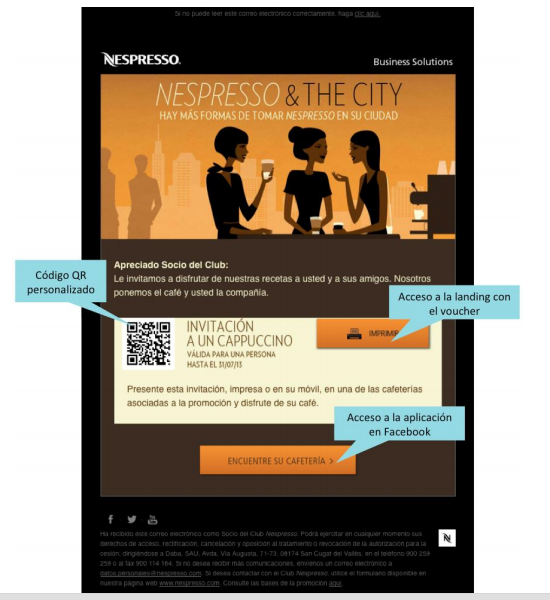
In order to take advantage of the impact of the email marketing campaign, it was decided to also include a custom QR code in the email, so that the user could redeem it for one of the recipes. Nespresso in the cafeteria
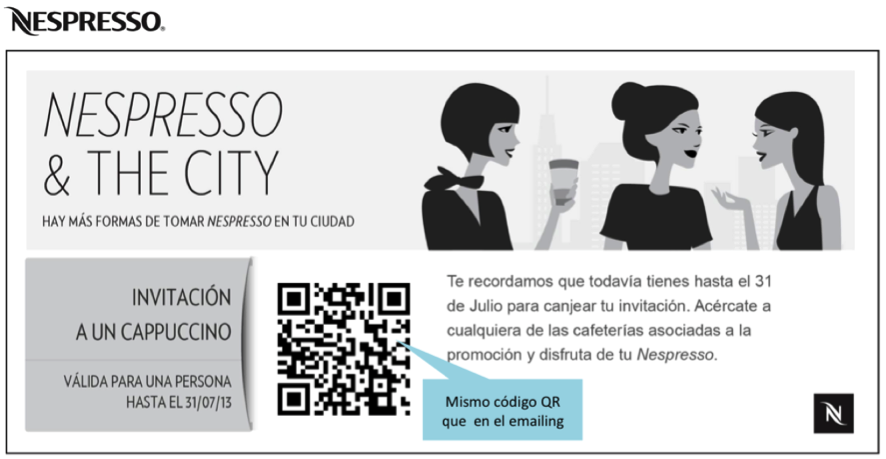
- Step 1: Personalization of the QR code in the emailing and voucher.
Since each user would receive a unique code (which would allow conversion tracking at the user level), and the voucher with the QR code was located on an external landing page, the QR code for each email had to be transferred to the landing page. In this way, each landing page was personalized with the QR code for each user.
Once on the landing page, the user could print the voucher. For responsible and economical printing, the voucher included colors in the gray, black, and white range.
- Step 2: Segmentation of the bbdd.
One of the objectives of the action was also to trace the behavior of the different segments of the database. There were 4 major categories of segmentation based on sociodemographic data with their respective variations.
In total, 24 possible combinations resulted in 24 segments. This allowed us to recognize which segments of the database performed better. This information is very useful, as when analyzed in time, it allows us to understand which segment is more reactive to which type of actions.
- Step 3: Inclusion of a Google Analytics tracking to determine the origin of traffic in the Facebook application (destination).
The email sent to each of the segments included tracking analytics identifying the source, medium, content, and campaign. In this way, by analyzing the traffic to the application, the validity of the email marketing metrics could be monitored at the destination. For example, if the number of clickers in a given segment was 5000, the number of unique visitors to the Facebook application from that same segment from an analytics perspective would also have to be 5000.
The interesting thing about the double measurement (in the email -source- and in the application -destination-) is that it allows for the detection of inconsistencies and, consequently, determining where one may have erred on the one hand, and giving reliability to the results obtained on the other.
- Step 4: referral to non-openers to maximize conversions.
One week after the campaign, the email was resend to all those users who received the first email but did not open it. This action managed to increase the number of unique visitors to the Facebook app and the number of redemptions in the cafeterias.
RESULTS
Total campaign
Openings*: 49,65%
Click rate**: 11.90%
*Total opens per 100 emails delivered
** Total clicks per 100 emails delivered
29% of the users who opened the email visited the application on Facebook
1,94% of users who clicked and visited the application also exchanged the coupon at the cafeteria.
