Ecommerce latency data and implications for email marketing

The Q2 Ecommerce Quarterly Report by Monetate, a personalisation software provider. This study has analysed the behaviour of repeat shoppers (excluding those who are part of loyalty programmes). Today we will analyse the data concerning the latency. But first, let us define the concept.
Latency is the average time between two events. In the context in which we find ourselves, we would say that latency is the average time elapsed between two significant events in the customer lifecycle. (e.g. the average time between a user registering and making their first purchase).
In relation to latency, the study shows that:
- For first-time buyers, the latency between first visit and purchase is 25 days and 3.5 sessions.
- For users who have already made a first purchase, the latency for the second purchase is 32 days.
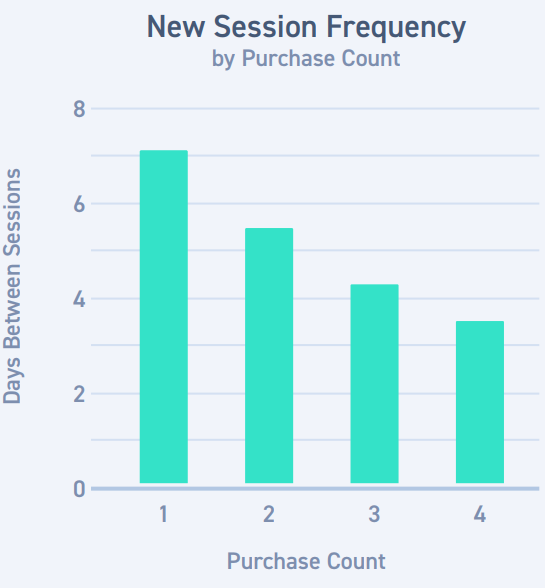
- Users with the highest number of purchases have the lowest latency between sessions: 7 days for those who have made 1 purchase, 5.5 days for those who have made 2 purchases, 4 days for those who have made 3 purchases and 3.5 days for those who have made 4 purchases.
Implications for email marketing
If we are able to obtain this information from our e-commerce, we can use it as a reference to improve our email marketing actions. One of the actions we could try is adapting the automatic life-cycle programmes according to these time windows. For example, if we have a referral system based on the most recent purchase, we can set up a series of shipments covering 4 weeks for first-time buyers. Another suggestion is to use email to improve latency data between two given events for users who are above average.. We can create a specific campaign to "nudge" these users to carry out the action we are interested in so that latency is closer to the average.
Other interesting data included in the report are as follows:
- Customers who have shopped between 2 and 10 times at a retailer have an AOV (average order value) 4.5% higher than those who have made only one purchase.
- Purchases are still primarily made online from desktop devices (67%), and around 16% are made from mobile.
- In terms of traffic, the 46% comes from mobile, while from desktop it is a 42%.
The report is available for download in this link.